Have you ever considered measuring SEO in the same way that paid ads and paid social are measured? Well, it’s possible and in this post I’ll share with you precisely how you can do just that.
But, before we do, let’s get into the weeds of the problem:
Last-click attribution is dead – or at least allocating a sale or lead to a single channel is.
If you’re still using the traffic acquisition report in Google Analytics for your channel and attribution reporting (particularly for SEO), firstly you should stop doing that and secondly keep reading.
This much more representative approach means we’re able to let go of that incredibly dated (yet way too relied upon) way of measuring revenue and transactions from organic search – single channel, session-based attribution.
What’s wrong with session-based attribution anyway?
Session-based attribution is like dedicating yourself to the gym everyday for a month.
You lose weight, gain muscle and then attribute 100% of your fitness success to your most recent workout. It’s a properly short sighted approach.
Nowadays there are more touch points than ever before when customers make purchases or businesses sign off key decisions and spending.
With so many marketing channels at our disposal, it’s completely unrealistic to assume that one single channel was responsible for doing all of the work to capture a sale.
For many of my ecommerce clients, I’m seeing an average of 4 to 5 touches to a website from multiple channels before a purchase is made by a user. I should also add, it’s also common to see that number higher too.
Let’s break the issue down further with a specific example here
Strap in – this will take me a few moments to explain.
Let’s say I’m in the market for a new keyboard and we kick off our exploration with a Google search:
‘Mechanical keyboards for work’
Naturally, with such a query, the first page is littered from results from big publishers such as PCMag, Tom’s Hardware, NYTimes and of course, in the midst of Google’s midlife crisis, Reddit…
I click through to a few articles to read and learn about the latest offerings. I’ve watched some guides and reviews over on YouTube and TikTok. I’ve also created a mental shortlist of the standout brands and the key features I’m looking for.
Nothing too crazy there, right?
Note: I’ve already engaged with a bunch of different channels and I haven’t accessed a retailer’s site yet.
I decide to now refine my search a little further:
- ‘Best keychron keyboards for productivity Mac’
Why this search? Keychron kept popping up in my research and the overall sentiment is impressively positive, but their keyboards aren’t cheap.
At the time of writing, this great (and super detailed) blog from Keychron themselves ranked in pos. 2.
It’s loaded with great info – of course it’s centered around their own range but it’s still solid advice. It’s so good in fact, it’s almost cemented my decision on what keyboard to buy there and then…
Note: This is now the first time I’ve accessed the Keychron website and the first time I’ve interacted with the brand directly.
But first – and naturally; in the midst of a cost of living crisis I want to scrutinise my potential purchase further.
So I continue to digest more content, review more alternatives and find the best price etc before spending my hard earned.
A week goes by and I see an ad on Instagram from Keychron – a nice little reminder to get back into the funnel.
Another few weeks pass after I’ve done more digging and research into the best keyboard option and it’s affirmed for me that the keyboard discovered in Keychron’s blog is the best one for my use case. The Keychron K8 Max
Now, here’s where it gets interesting…
Again, at the time of writing, the first page of Google for ‘Keychron K8 Max’ was dominated by shopping ads and paid results and likely still is.
No surprises there, my query has a strong purchase intent and where there’s strong purchase intent, there will always be a sh*t ton of ads.
That does mean, however, that I’m significantly more likely to click an ad over an organic result when I’m ready to buy.
I head back to Google and click on a few of Keychron’s shopping ads over the next week; add the item to basket, then I finally I make a purchase.
How would this example play out in Google Analytics?
In the ‘go to’ Traffic Acquisition report in GA4 my purchase would have been attributed (via last-click session attribution) to Paid Search.
Additionally the Google Ads platform would also count this sale and associated revenue too.
In this case, there’s zero credit attributed to organic search in the traffic acquisition report yet so many brands use it as their staple and default.
Hopefully now you can begin to see the problem here – paid search gets the lion share of credit with very little (if none at all) attribution to organic search.
However, it’s the organic result and the Keychron blog that ‘sowed the seed’ and got me to take their brand seriously in the first place.
It’s also the only written piece of content in my purchase journey (outside of the Reddit universe) that was properly helpful and didn’t stink of ‘affiliate’ drivel – which unfortunately is an all-too-common sight for product research based search queries nowadays.
Anyway, my point here is that some of that sale should be attributed to the channel that introduced that customer to the website for the first time, right?
Without SEO, it’s much less likely that the aforementioned piece of content would have been surfaced in my research at all – and as a result, I could have purchased a keyboard from another brand altogether.
It’s getting increasingly difficult to showcase and prove the value that SEO has in ecommerce.
So how do we fix this in GA4?
Well, the good news is, there are two ways to handle this in Google Analytics. One is pretty simple as it taps into pre-existing reports ready to go in GA4. The other is a little more complicated but in my opinion it’s well worth the effort and it’s by far my most recommended approach.
Option 1: Leveraging pre-existing reports
Pros
- Super simple and the easy option as we’re leveraging ‘out of the box’ reporting
- It’s retrospective
Cons
- Limited flexibility and customisation
- The good stuff can’t be imported into Looker Studio (at least not right now)
Option 2: Building out a custom audience and event trigger
Pros
- Much more flexibility as we can customise parameters and rules to suit
- Can be easily imported into Looker Studio for easy client-facing reports
- Better at showing true ROI of SEO
Cons
- It isn’t retrospective – only works from the setup date onwards
- More complicated to setup
The second option is more bespoke, but offers you greater control and as an added bonus, it can be integrated nicely into Looker Studio reports – great to help illustrate how SEO is driving results.
Option 1: The lazy approach
No judgement here, not everyone wants to open up the bowels of GA4 to get to the data they need. If you need insights quick and don’t have the time to setup something more insightful I get it.
Let’s dive in. The first step is to use the User Acquisition report. It’s located in Reports > Life cycle > Acquisition > User acquisition.
Instead of reporting based on last-click, this report details performance from a user’s first-click – so when a user first discovered and accessed your site.
The second part of option 1 is getting your hands on a report that’s weirdly tucked away, so you may not have come across it before.
It’s located in Advertising > Attribution > Attribution paths and it looks like this:
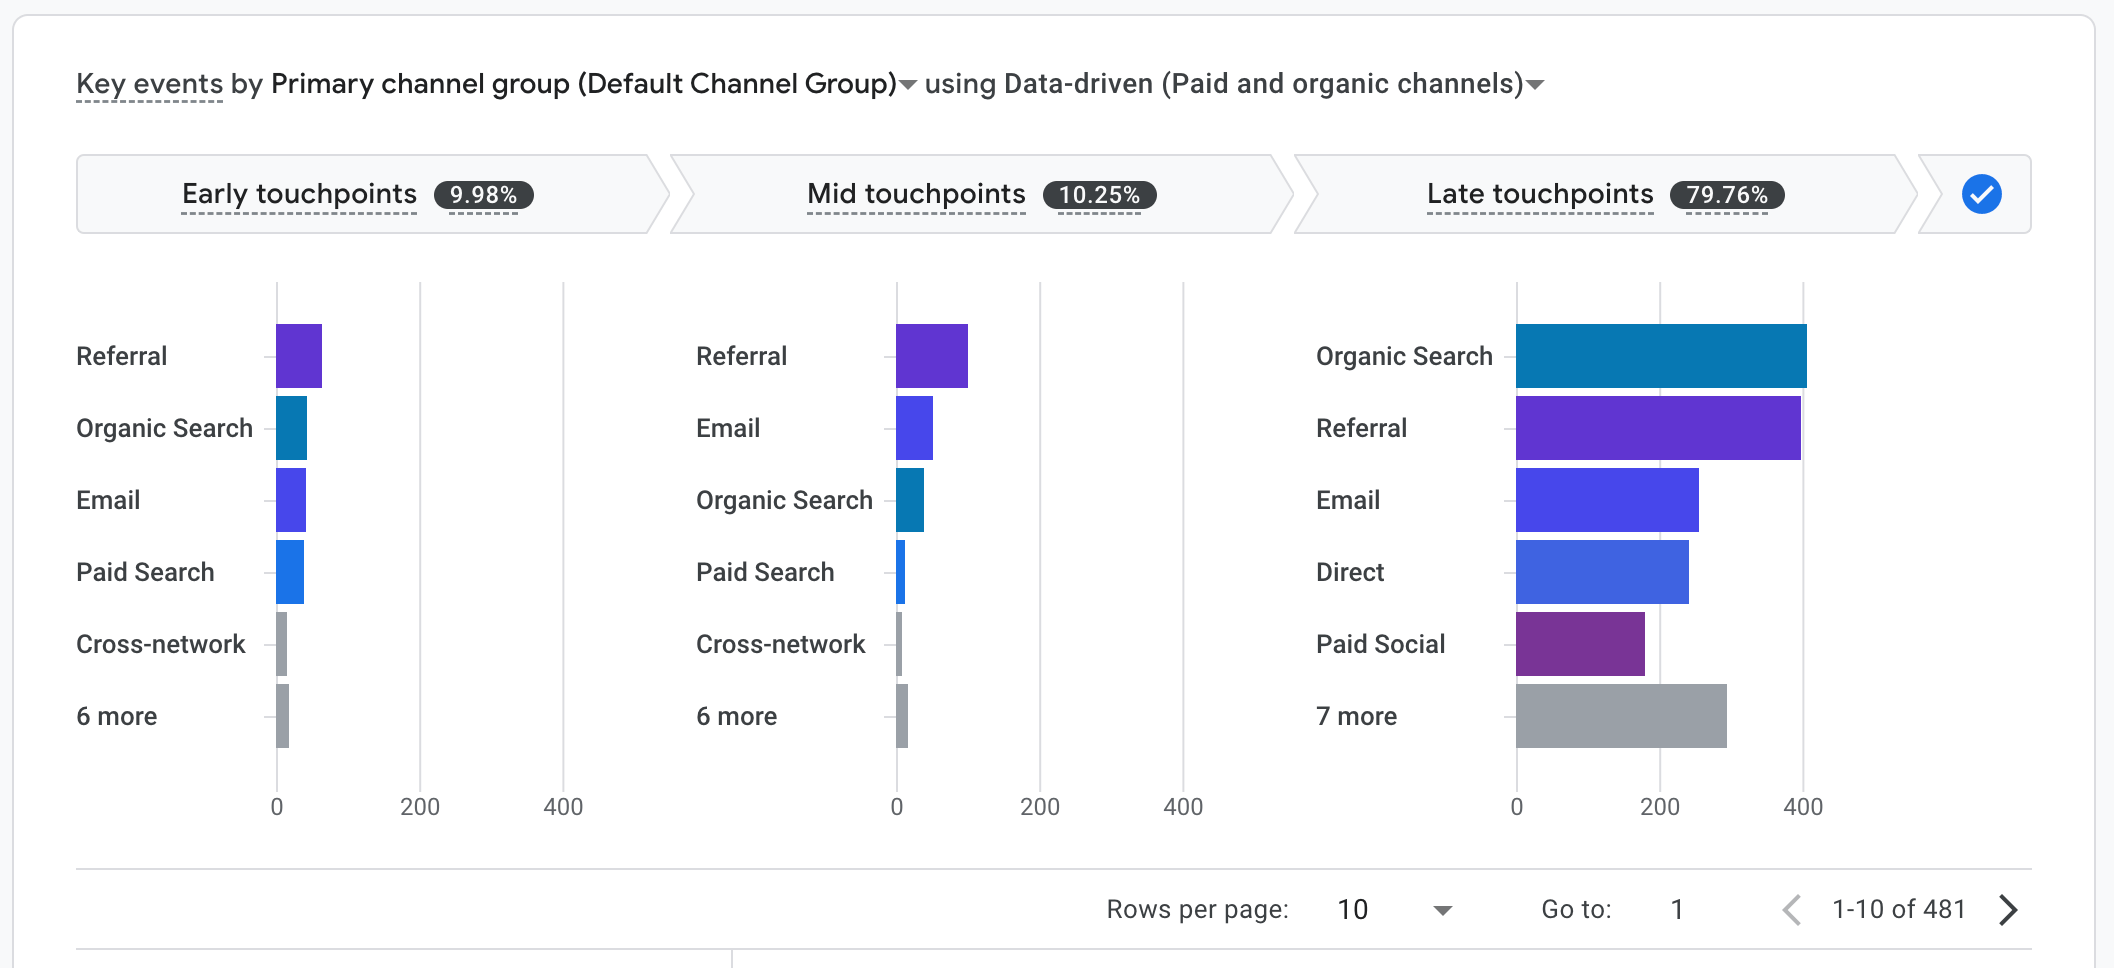
There’s a lot more to this report that I’m not covering in this post – but I urge you to go and check it out as it covers a lot of ground and highlights a lot of cool data about attribution you may be otherwise missing.
A key takeaway from this data is just how influential organic search is early on in a user’s buying journey.
It’s the 2nd highest performing discovery channel when it comes to supporting later conversions.
What’s crazy is that none of these early touchpoint conversions report in the standard traffic acquisition report – this means that report is grossly underselling SEO in a big way.
In the above example, early touch points showcase the first 25% of channels used that later resulted in conversions where there was more than one touchpoint to make a purchase.
Mid touch points are the middle 50% of touch points and late touch points are the last 25%.
A touch point in this example is the channel that the user’s session was attributed to.
Let me demonstrate this with an example. So if a user had the following touch points:
Organic search | Paid search | Referral | Direct
The early touch point would be Organic (25% of the path), the mid touch points would be both Paid search and Referral (middle 50% of the path) and the late touch point (last 25% of the path) would be Direct.
Note: In the ‘go to’ traffic acquisition report, the sale would have been attributed 100% to the ‘Direct’ channel grouping. 0% would be attributed to organic search even though it’s how this customer discovered the website in the first place.
SEO is being undersold in that report! Now hopefully it makes sense why I’m so passionate about telling people to stop using it for attribution data.
Option 2: The ‘hands on’ approach (recommended)
For me this is an incredibly powerful approach to SEO reporting as it decouples traffic as the headline metric and it takes revenue reporting far beyond the standard (and incredibly narrow) session-based data we’ve been using for years.
Disclaimer: This option does require a bit of work (I reckon you could have it up and running in 10 mins or less) and a bit of patience whilst the data collects over time.
For this to work, first we need to set up a custom audience and set up an audience trigger too. I’ll explain where the trigger comes in later on.
Here’s the setup I’ve configured for the audience:
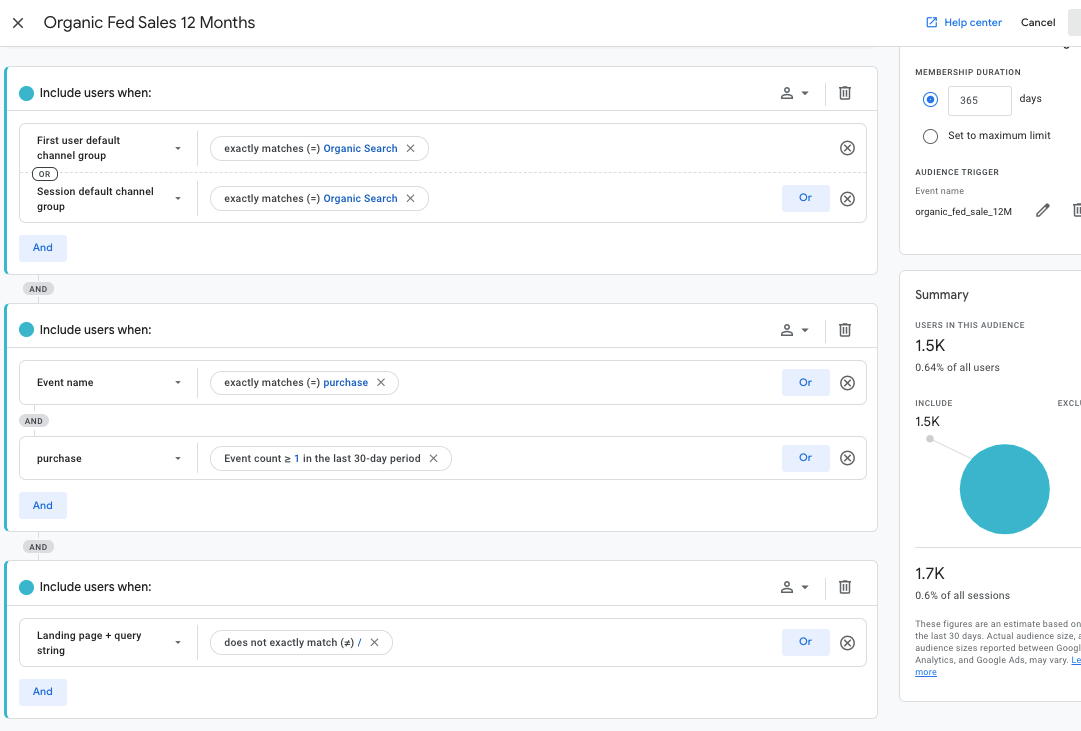
Ultimately the audience works like this if all of the below conditions are true:
- User entered the site via organic search (excluding the homepage)
- User makes one or more purchases from the same or any subsequent visits using any channel
- Those purchases must have been made within 30 days of that organic visit
Providing all of those conditions are true, that user will be added to this audience and will remain ‘subscribed’ to it for 12 months.
Note: In the example audience I’ve chosen to exclude users visited the site via organic search if they landed on the homepage. This just prevents me from ‘over-reporting’ on organic sales by excluding branded searches.
It’s similar to how PPC agencies (good ones) exclude branded campaigns from reporting metrics.
It’s up to you whether you decide to include branded organic searches or not in your audience.
This audience is the key that allows us to demonstrate the real, full value of SEO and show how much cash and how many transactions organic has helped to drive.
It also keeps us away from the super-restrictive (and very short sighted) session-based attribution.
Adding them to this audience for 365 days allows you to do full YoY (year-over-year) comparisons too, which is essential particularly if you or your client’s business is seasonal or you just want to compare one full year to the next in the future.
Customise your audience to suit your criteria
Note:To refine this a little further, you may also decide to be more selective with the URLs or subfolders you wish to include in this audience for greater segmenting.
So for example, you could build an audience that just counts sales from visitors landing on category pages, or other URLs you’re actively working on for SEO. Just amend the audience accordingly to suit!
Another example mod is to only include users that made a purchase within 30 days of them accessing your site for the first time via organic search. This would then allow you to better understand how organic search is performing commercially as a pure discovery channel.
Important: Adding users for 12m does not = a 12m attribution window!
Audience membership duration (which is how long a user stays subscribed to an audience) does not mean that there’s a 12 month attribution window for the user to buy from their first click.
That would be an insane attribution window – even by Meta’s standards 🤣.
To be crystal – the actual attribution window is set to 30 days – which is specified in one of the steps in the audience logic – more specifically ‘Event count is equal or greater than 1 in the last 30-day period’.
Audience membership for 12 month means that if a user did make a purchase within 30 days of their first visit – they would be added to the audience for 12 months.
However, if they made their first purchase 35 days after their first visit, they wouldn’t be included.
This audience allows us to copy the attribution method adopted by Google Ads and apply it to SEO
This gives SEOs a real commercial seat at the table and allows us to report on performance similar to the Google Ads, paid social and even email marketing platforms
SEOs can now report on revenue generated within 30 days of their first visit (just like Google Ads) instead of the incredibly short sighted session-based reporting that SEOs currently use.
Using this audience, we’re now able to deliver ROAS numbers for SEO. (Return on actual agency spend?) 🤔
The audience trigger and why it’s important
Additionally, I’ve set an audience trigger.
This fires an event every time a user is subscribed to the audience. We can then use this event to build out SEO KPI dashboards to power trend graphs and scorecards etc in Looker Studio later on.
You can name the event whatever you wish – however, I recommend you stick with an event name that’s highly recognisable and makes sense to both you and your clients.
Of course, you could also just import the audience directly into Looker Studio – but this offers up another way to interact with the same data and offers a little more flexibility depending on what it is you’re wanting to build over in Looker Studio.
How does the audience data look in GA?
Firstly, it’s important to remember that audiences are retrospective and only work from the day of setup onwards – so you won’t see any data for a while until users are enrolled based on the criteria set.
That being said, here’s what the audience looks like for one client just a few days after setup:
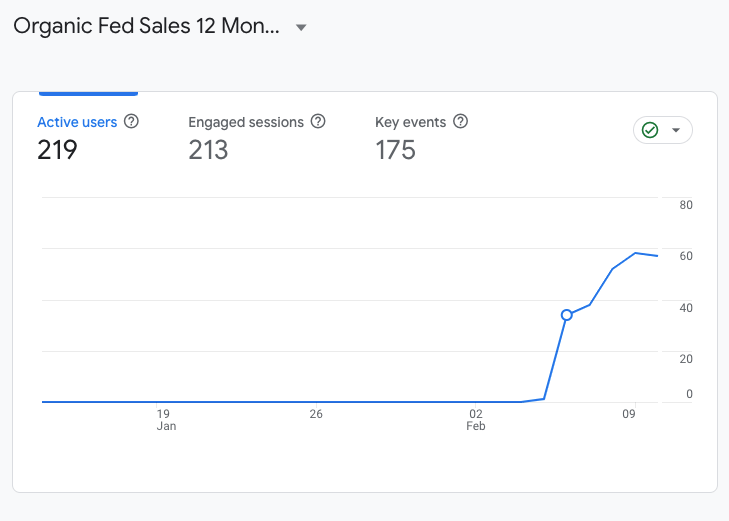
You can see there’s already data starting to present itself. This graph is great as it shows my clients a running total of how many users are subscribed into the audience on a daily basis.
In client terms? Here are the number of customers that purchased within 30 days after they first found us via organic search / SEO.
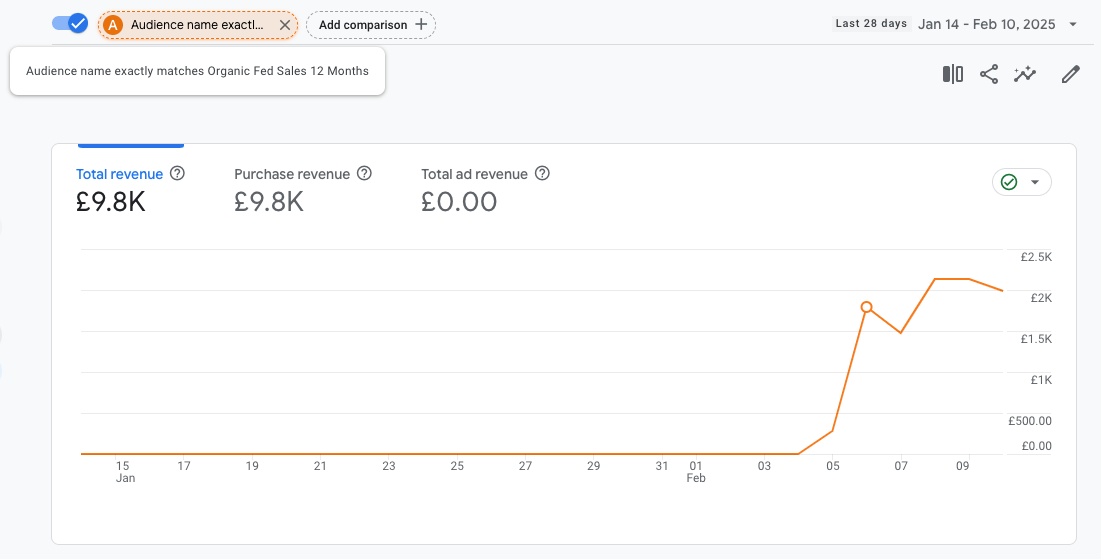
This graph is a little more hard-hitting, naturally as it’s highlighting revenue but it’s pulling data from the same audience.
However, instead of active users it’s showing revenue generated on a daily basis
So in summary, I’m able to showcase to this client that organic search (for mostly non-branded terms) has helped to generate £9,800 in sales in the last 5 days. Not bad, right?
Note: Remember, this is showing the client how much cash the organic channel has helped to generate.
Specifically customers who initially found us via organic search (from any page excl. the homepage) and went on to make at least one purchase within 30 days (from any channel).
![]()
I’m also able to show the client that the £9.8k in sales came from a total of 171 transactions (of which 152 of them were from new, first-time customers).
Using audience data to help showcase the ROI of SEO
Just to recap, typically when we’re reporting on sales and revenue generated from organic search we either:
- Use session-based attribution data – Which only counts a conversion if a user’s session was attributed to organic search AND they made a purchase in the same session
OR
- Use user’s first channel attribution data – Which counts all conversions if a user’s first session was attributed to organic search
Both of which are, in my opinion, extremities at either end of the attribution scale – both aren’t fit for purpose and it’s not how the market typically measures performance.
These two methods are even more out of place when you consider that pretty much all other marketing platforms (paid ads, affiliate tracking and even email platforms like Klaviyo) use attribution windows instead of session-only or user’s first channel attribution modelling.
So why don’t we do the same for SEO? Well, with this audience, we can level the playing field and ensure we’re measuring (and comparing) apples to apples rather than marbles!
How to calculate the ROI of SEO using ROAS
To get the ROI of SEO, naturally you need to start with your fees and compare that to the revenue generated from the audience we’ve built to output your ROAS number and give a stronger understanding of ROI.
Note: Just like with Google Ads or any other PPC platform, you take your revenue generated and influenced by SEO and divide it by your SEO costs to give your client an organic ROAS.
Bonus tip: Create a calculated field in Looker Studio to keep the organic ROAS metric visible in all your organic reporting!
By communicating and sharing organic ROAS with your clients, it becomes much easier to showcase and justify just how far their investment in SEO is impacting sales and revenue.
That gives you more time and energy to focus on what’s important – improving organic performance for clients instead of struggling to identify the value you’re adding.
HTH!