So if you’re new to Google Analytics 4 (previously Google Analytics App + Web) then you may have noticed a new menu whilst having a look through the menus called DebugView.
It’s not new as such as it’s been in Firebase for sometime now, but it is new to Google Analytics and it’s new to me as I’ve not used Firebase before. As you’re here it’s likely the case for you too.
Now, I’m hitting DebugView pretty fresh-eyed and there many be others out there who could be making the same mistakes as I was before the penny finally dropped and I got my head around it.
Don’t get me wrong, I’m happy DebugView is a thing but…
There are a handful of irritating quirks that it comes with. GA4 is still pretty new and shiny and even universal analytics (UA) has its issues. However, had I come to terms with its quirks sooner, it would have saved me both a bunch of time and a lot of hair pulling getting my GA4 rig to play nicely with website data.
So, without further ado, let’s jump in to it!
So, what’s DebugView anyway?
DebugView pretty much does exactly what it says on the tin – it allows you to debug events in GA4. It’s a godsend, because the only way to debug Google Analytics prior to DebugView was to use browser extensions like the Google Analytics Debugger, or if you’re a wizard, vanilla browser dev tools. (Shout out to the network tab debuggers!)
As great as they are, (Adswerve’s dataLayer inspector tool is my personal favourite) their visibility in to how Google Analytics is interpreting and ‘ingesting’ data sent from dataLayer.push or gtag is pretty limited. This is where DebugView really comes in to its element.
DebugView presents you with the exact event data that it’s received from the website you’re reviewing providing you’re in debug mode.
What cool features does DebugView have?
What’s cool about the new tool is that you don’t have to have DebugView open for it to capture data. You can be on another screen and again, providing you’re in debug mode, it will keep tabs on the events for you providing your debug session is active. Super handy if you’ve forgotten to fire up DebugView before firing events you’re wanting to inspect.
One of the main features that DebugView brings to the table is the timeline function. You can see all events that have been fired at your GA4 property within the last 30 minutes.
Perfect if you’ve refreshed the webpage or closed the tab. It helps present debug data loss. Equally, it’s handy if you just want to compare events before and after tweaks etc.
Additionally, if you’re deep into some debugging, you can freeze the timeline to avoid it wiping out juicy event data once the half hour window has elapsed.
Ok, can you talk about its quirks now?
Absolutely! So, first thing’s first…
DebugView doesn’t tell you whether a particular event is valid or not. It will only let you know that the event has been received by GA4 and display the data that it’s captured for the event(s) in question.
This is the first and key quirk and oh boy – I really wish I knew this sooner! I may have been wrong to make this assumption, but if I’d seen an event appear in DebugView, I would think that it meant the event has:
- Been received by GA
- The event is therefore is valid
That couldn’t be further from the truth! Ok, so the first point is true (it wouldn’t show on DebugView if GA4 hadn’t received that event).
The second point isn’t true at all, though. The event could be missing required fields meaning it fails and it’s not all that easy to see which events are valid and which aren’t.
To make it clear as to what I mean…
Let’s look at a specific example
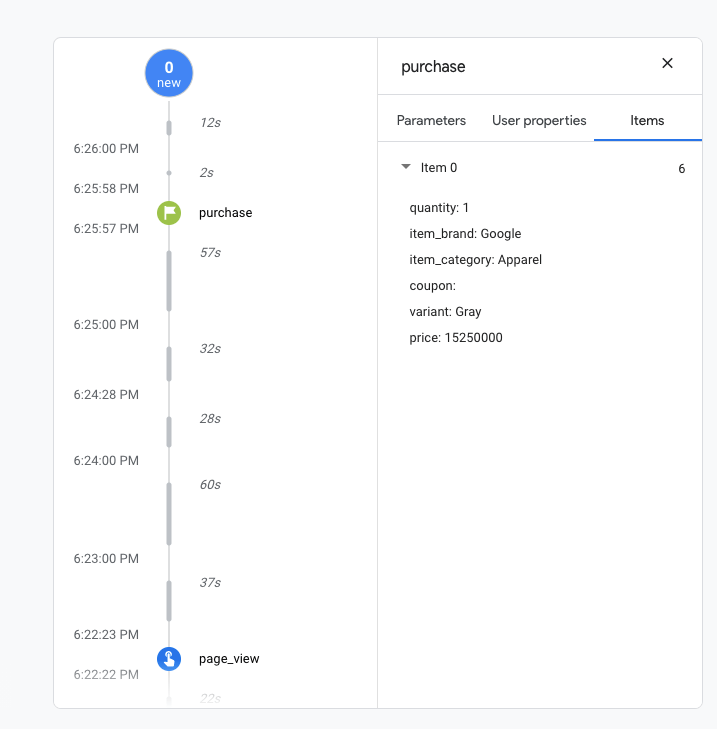
I’ve fired the exact event below in my GA4 playground property. As you can see in the annotations, an item_id OR an item_name must be sent for the event to be valid.
The official Tag Manager GA4 ecommerce developer guide doesn’t always make it clear as to which variables for any given event are mandatory. However the Google Analytics 4 Events reference guide does and it’s more comprehensive too.
In this example dataLayer.push purchase event below, you can see I’ve set both the item_name and item_id variables to undefined which will cause the event to fail.
dataLayer.push({
  'event': 'purchase',
  'ecommerce': {
	'currencyCode' : 'GBP',
    'purchase': {
      'transaction_id': 'T12345',
      'affiliation': 'Online Store',
      'value': '35.43',
      'tax': '4.90',
      'shipping': '5.99',
      'currency': 'EUR',
      'coupon': 'SUMMER_SALE',
      'items': [{
        'item_name': undefined,
        'item_id': undefined,
        'item_price': '15.25',
        'item_brand': 'Google',
        'item_category': 'Apparel',
        'item_variant': 'Gray',
        'quantity': 1,
        'item_coupon': ''
      }]
    }
  }
});
You can see above that both item_id and item_name variables are missing from the event shown in DebugView.
However, if you look at the DebugView timeline, the fact that the event has registered here could be somewhat misleading and potentially give you a false positive if you’re not vigilant or know precisely what you’re looking for.
As you can see from the data passed to GA4 in this purchase event, the mandatory item_name and/or item_id are both missing.
This is even more confusing when conversion events are brought in to the mix as you’re presented with a green flag when a conversion event is registered in the timeline.
The green flag actually denotes that this event is a conversion based event. However, the green colour could easily lull you in to thinking that this particular event is a successful one.
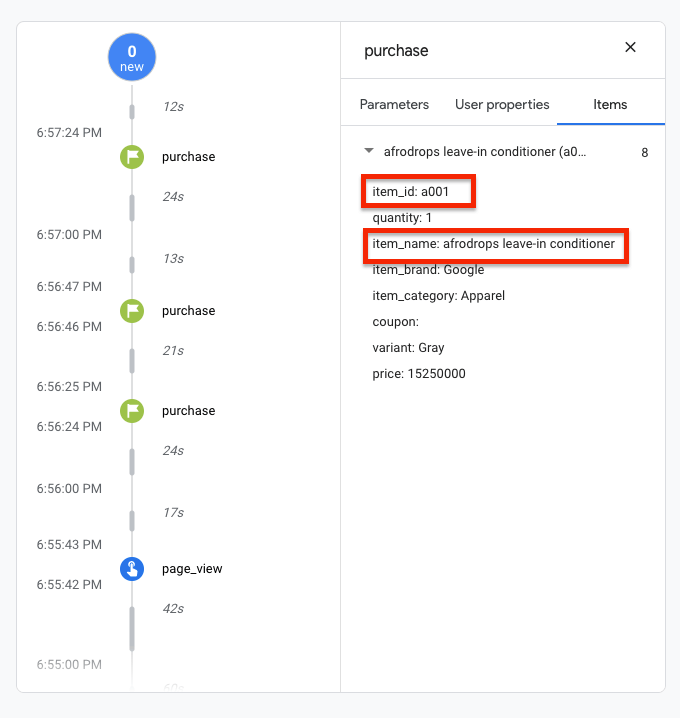
To show you just how little difference there is between an invalid purchase event and a valid one, I’ve fired the same event code as in the first example. However, this time the item_name and item_id variables will both have values thus making the event valid.
Both the item_id and the item_name have values set in this example
As you can see, this event is now valid, yet it looks virtually identical to the invalid event in the first screen grab.
In summary, the DebugView will allow you to see the events that have been fired and sent to GA4, but it won’t make it clear as to whether those events are valid or not. It’s important to make sure that you also check all the mandatory data is present and formatted correctly to be sure the events you’re debugging will work once live.
It’s also important to add that those invalid events won’t appear in their respective reports although you may see them in realtime events data.
How DebugView displays pricing data is weird
Pricing looks weird, at least to my eyes in DebugView. It can quite easily make you believe that an item you’ve added to basket for say £15.00, could be interpreted by DebugView as costing in excess of £1m. Yup, really!
It resulted in me spending an embarrassing amount of time researching how GA4 wants pricing data and making countless (and unnecessary amends) to the dataLayer price variable.
Let’s take a look at another example to show you what I’m getting at. Below is the dataLayer.push event that I’ve sent. Pay particular attention to the pricing variable here.
dataLayer.push({
  'event': 'add_to_cart',
  'ecommerce': {
		'currencyCode' : 'GBP',
    'items': [{
      'item_name': 'afrodrops ultimate leave-in conditioner',
      'item_id': 'a002',
      'price': '18.99', // Perfectly formatted price data :)
      'item_brand': 'afrodrops',
      'item_category': 'leave-in conditioner',
      'item_variant': '500ml',
      'item_list_name': 'Search Results',
      'index': 1,
      'quantity': '2'
    }]
  }
});
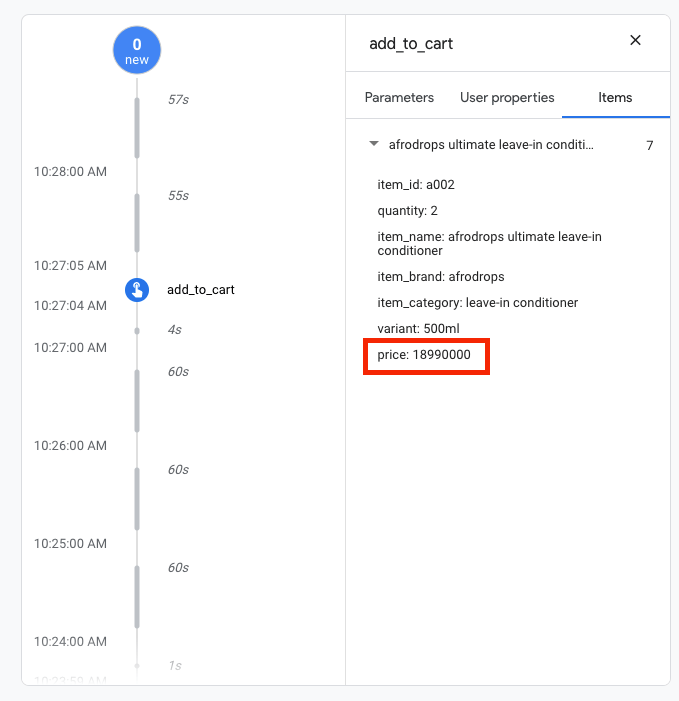
Look at how different the pricing data is from the dataLayer.push event compared to the price indicated in DebugView
As you can see, the price in the dataLayer.push event is precisely ‘18.99’ however in DebugView, that same pricing data is displayed as ‘18990000’ which, to be frank, blew my mind!
I’m someone with more smarts than me can provide a solid explanation as to why DebugView is displaying pricing data like this, but for me at least, it would make it a lot clearer to display the pricing data in the same way it’s displayed in the dataLayer.push event.
After all, pricing data is crucial to get right in any GA4 ecommerce implementation. The last thing you want is an item that’s £18.99 being interpreted by GA4 as £18,990,000.. Calling that a discrepancy would be putting it lightly!
Actually, Simo Ahava put this pricing data fiasco straight for me in the comments of this post. To quote his response to a comment:
“Price works as a number or a string, and it works as floating point values as well. So “11.12”, 11.12, “11.1200” etc. all work just fine…”
Also, for additional peace-of-mind, below is a screen grab taken from GA4 for the same item using the same pricing formatting and it’s working just fine. No £multi-million purchases in sight!
In summary
DebugView can be a huge help, but be vigilant when using it to debug your events. Hopefully, Google will continue to make enhancements to it and make it a more invaluable tool.
One enhancement I certainly can’t wait for is a clear indication as to whether an event is indeed valid or not and precisely what needs to be fixed/added to make it so.
Right, back to more learning and poking about in GA4!


